At long last I have found some time to post here again. Well actually I don’t have the time but I did it anyway. The thing is – I left a trap in an article I wrote that would force me to make time here – and it worked! This will be brief – or I ‘ll never get it done.
I wrote an article for Sound Video Contractor – about arrays. Click on the link and you can read it. It ended up being more in-depth than I originally planned and so it will be a two-part affair. And actually it is more in depth than even that so I have elected to post some of the data files here – since it was just too much for a mag article.
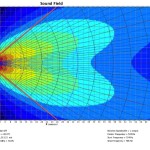
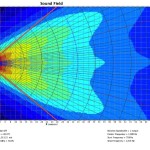
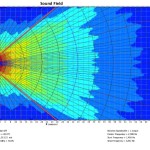
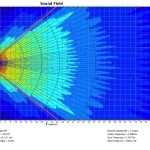
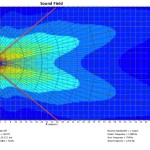
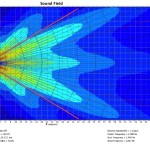
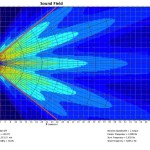
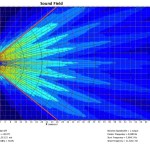
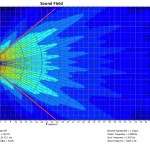
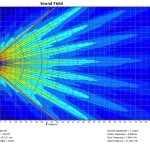
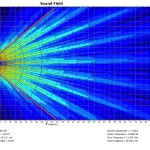
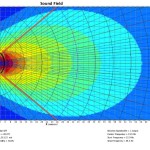
This post contains data related to figures 3-5 in the article. What is discussed there are 8 different ways to 80 degrees of coverage – 1 box, 2,3,4,8,16,16 and finally 40 boxes. The trick here is that if you take 80 degrees and divide it by the number of boxes – you will see the splay. For example 2 boxes splayed at 40 degrees, 3 at 27, 4 at 20 etc. The splay angle is critical but the coverage angle of the individual element plays a major part also – especially at lower quantities. case in point – the two x 40 degree array uses 2 40 degree boxes at 40 degrees. The 3x array uses 3 boxes that are 30 deg each, splayed at 27. As the quantity rises we can see that the role of the individual element becomes overwhelmed by the splay angle. In the case of the 40 box array the splay angle is 2 degrees (40 x 2 = 80 deg) but the box is a 10 degree box. The fact that this individual box is 10 degrees is not apparent in the combined shape – which makes a very sharp 80 degrees.
The complete set of data shows 10 octave resolution plots for each of the eight arrays. All of the speakers are front-loaded woofer except for the 3 box array (which is the LF and HF horn-loaded Meyer MSL-4). Therefore it’s low frequency response is an outlier because its individual response is so much narrower than the others. The single box, 2,3,4 and 8 box arrays use 2-way elements with relatively constant beamwidth horns. The 16 and 40 box scenarios use line array type speakers, whose directionality increases with frequency. There are two 16 box scenarios: 16a is a smaller box with wider individual angle than the 16b ( a larger box with around 1/2 the individual angle. This was done to help demonstrate the similarities and differences when we use the exact same quantity and same splay angles but start from different elements.
Some of the trend lines to note here – you can see that from 4 kHz on up the coverage pattern is 80 degrees for ALL of the 8 scenarios. The shape of the 80 degrees can vary considerably.The single unit has the most gradual rate of loss over angle, whereas the 40 speaker versions maintains 0 dB for virtually it entire angular spread and then finally drops off like a cliff. As a continuum we can see the following trend: increased quantity and smaller splay creates sharper edges. The dominant feature in the high quantity/low splay angle arrays is a high percentage of angular overlap. The small quantity/large splay angle arrays have low overlap, and also have softer edges. If we just look at this as a simple spreadsheet of HF coverage angle, then we see 80 degrees across the board. On the other hand, when you look at the coverage SHAPES, you see a great deal of contrast as to how the 80 degree shaper is filled.
As we move down through the midrange (250-1kHz) we see substantial variations in both shape and defined coverage angle. The array show a similar pattern where the coverage narrows and then widens below. This leaves each array with a 3-part response: expanding wider at the low end, a small transition range where the pattern narrows in the midrange, followed by a steady coverage angle above. The frequency range where the narrowing occurs falls with rising quantity and size (e.g. the mid-sized 2-box array constricts at 500 Hz, the larger 3-box at 125 Hz. The smaller 16 box array tightens at 125 Hz, while the larger 16 box arrays does the same an octave lower.
The last feature is the runaway low end. As quantity and size go down, the break frequency goes up. This can be easily seen by the lines flying into the top of the graph (which finishes at 180 deg). The 40 box array is the last to budge, only expanding to 100 degrees by 31 Hz. Have fun rigging that!
In conclusion: isolation summation is the dominant shaping force in the high end – and this is why the shape stays a consistent 80 degrees. Overlap is the dominant shaping force in the low end. The higher quantities have more overlapping elements to bring to the party and therefore enjoy a wider range and more uniform LF beam width. The squeeze point in the response is the transition zone between these dominant shape factors.
This post is pretty brief – but bear in mind that this is a add-on to the article. Together they should hopefully make some sense.
Thanks for your time. Comments are welcome
And here are the files:

___________________
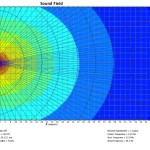
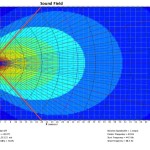
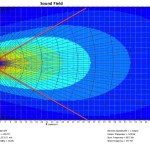
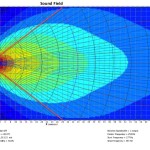
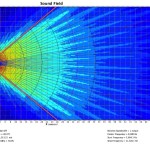
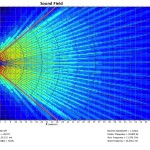
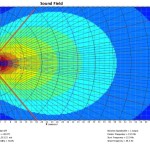
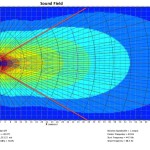
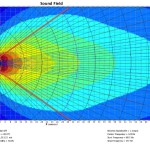
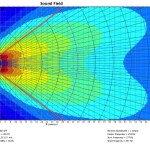
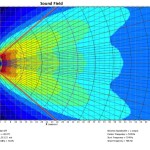
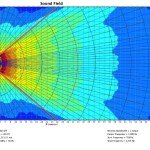
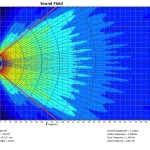
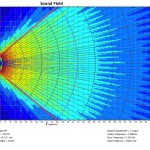
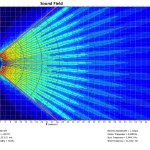
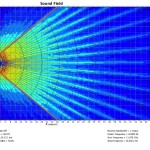
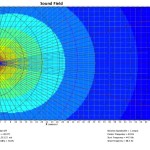
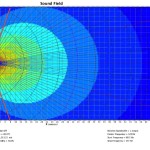
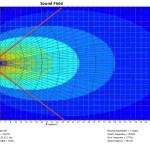
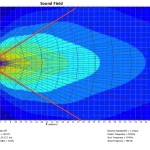
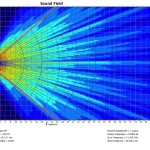
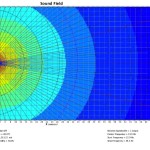
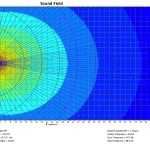
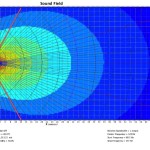
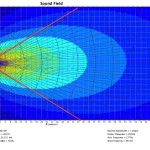
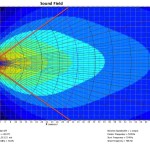
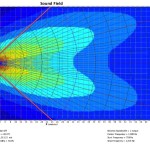
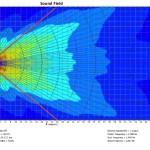
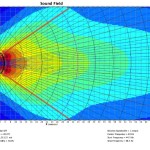
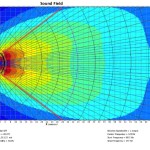
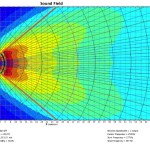
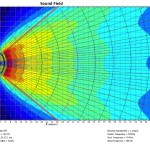
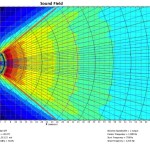
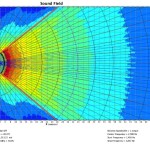
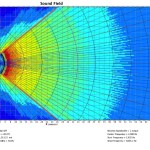
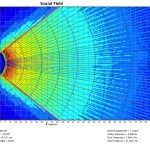
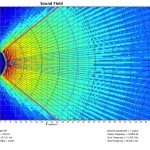
Next is the MAPP plots for all the speakers in the following order (I was not able to outwit the computer and get them in the order i wanted……
1) 16 10 deg speakers at 5 deg – small (Mina)
2) 16 5 deg speakers at 5 deg – large ( Milo)
3) Single 80 deg Speaker (CQ-1)
4) 2 x 40 degree speakers at 40 deg (UPA-2P)
5) 3 x 30 deg speaker as 27 deg (MSL-4)
6) 4 x 20 deg speaker at 20 degree (JM-1P)
7) 8 x 10 deg speaker 10 deg (Mina)
8) 40 x 10 degree speaker at 2 deg (Mina)

Great to have you back Bob!
Once again expanding insight on a subject all to often left to assumptions.
Thanks as always Nathan,
Sorry to be slow – I thought I already responded to this. Been over the top busy lately……..
this blog is amazing Mr. Bob…I´m going to continue learning of this article, as always.
Greetings !!!
Thank you for your support Arnold!
I have sent part 2 to the magazine so it will be in the next issue.
6o6
Great article Bob! I was thinking of you the other day when I came across a Wikipedia entry. I came across an entry in Wikipedia about under “Haas effect”. There was an entry about using it for public address systems and adding 10 to 20 ms, which we know causes more phase issues that it solves by adding delay time and screwing up your coverage seams, while still not actually creating the desired effect since the two sources are not discrete, but instead they are a blended coverage area. I was wondering if you, or someone you might know would be willing to write an entry to Wiki to debunk that for the good of the general public. I could do it, but maybe not as eloquently as you.
The blog is awesome, thank you Mr. 6o6.Greetings.I am a big Fan